
I would like to use my first post to introduce my portfolio. The start date is the 25th September 2020. I will update the performance and composition of the portfolio every quarter, starting the 31st December 2020. However, I will put any buy or sell movement in the Trading Diary section of the blog.
The portfolio currently has 22 companies, where the top 10 positions reach the 59% of the portfolio. The cash position is 6% and all the companies are based in Europe.
The following table and graph show the distribution of the portfolio in relation to the market capitalization of the companies:


81% of the portfolio is invested in companies with a market capitalization below 1.000 million Euros. As explained in the Investment Strategy section of the blog, small caps are my investment focus.
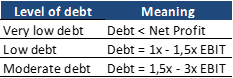
The next table shows the distribution of the portfolio in terms of the non-cyclicality and cyclicality of the businesses:
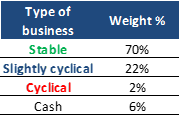
The stable (or non-cyclical) businesses are generally profitable regardless of economic trends because they produce or distribute goods and services we always need, including things like food and beverages, food and beverages packaging, tobacco, pharmaceuticals, power, water, and gas. These companies are also called defensive stocks because they can defend investors against the effects of economic downturn.
Cyclical companies follow the trends in the overall economy. Cyclical stocks represent companies that make or sell discretionary items and services that are in demand when the economy is doing well. These are goods and services that people cut first when times are tough. Examples of cyclical industries are travel, construction, furniture, car manufacturing or car manufacturing supplies.
The following graph shows the distribution of the portfolio in terms of the net financial debt that the companies have:
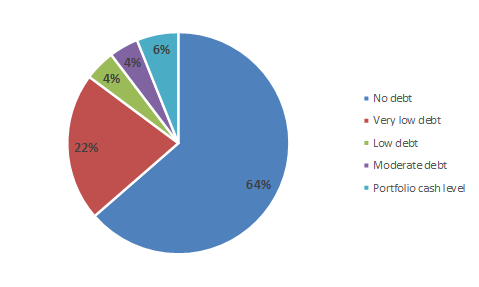
As the graph shows, there is only a 4% invested in companies with a net financial debt between 1,5x and 3x EBIT. In fact, it is just one company, Fromageries Bel, which is one of the top worldwide branded cheese manufacturer. This type of companies normally can handle these debt levels without any problem.
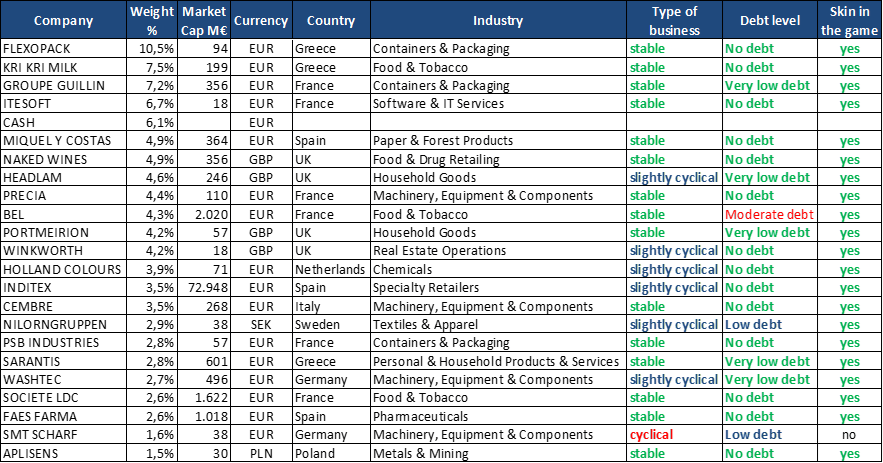
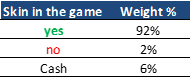
As you will see in the next table, almost all the companies, except one, are owned either by a family or by the founding CEO of the company, which is still in place. For me, as you can see in the Investment Strategy section of the blog, is one of the most important things to look at when you are analysing a company.
The next graph shows the currency exposure of the portfolio:

The following graph shows the country exposure of the portfolio, considering where the companies are based:
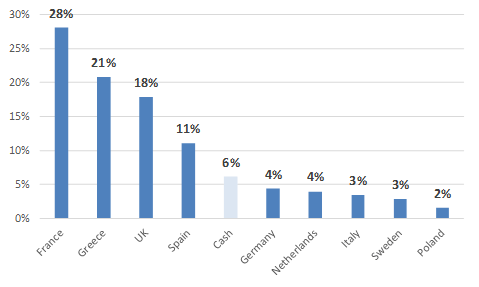
I would like to mention that the exposure to Greece is explained by these three companies:

As you can see, these are very defensive businesses and in two of the companies, the international sales are more than 50% of the business.
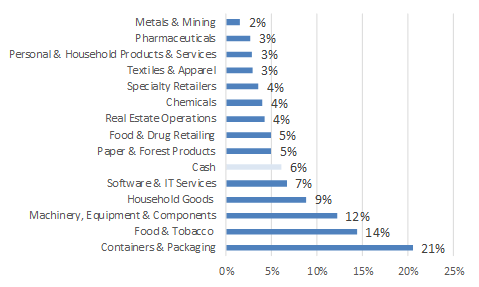
Finally, the next graph show the industry exposure of the companies in the portfolio:
Disclaimer: The purpose of this blog is not to provide financial advice or recommendations to buy or sell specific investments. Please, do your own research before making any investment decision. If you are unsure of any investment decision, you should seek a professional financial advisor.

19 thoughts on “Presentation and structure of the portfolio on 25th September 2020”